
• Virtual Capacity vs. Physical Terrain: Why 1-GW Software Aggregations Cannot Fix the Peaker Creep

    By Mica C. Tufillaro | Founder & Principal, LIS Analytics™

    Two headlines crossed the wires this week that illustrate the dangerous divergence between how the technology sector models grid solutions on paper and how physics operates at the substation fence.

    In Silicon Valley, Google and Voltus announced a partnership to assemble a 1-gigawatt “virtual power plant” (VPP) across several U.S. markets. The initiative promises to unlock flexible computational loads, orchestrate distributed energy resources, and mitigate capacity crunches using algorithmic dispatch.

    On the same day in Texas, environmental and grid reports revealed that nearly 300 planned data center projects across ERCOT risk reversing decades of state air quality gains. Because bulk transmission queues and firm capacity additions take years to build, facilities are increasingly relying on massive behind-the-meter diesel backup fleets—effectively functioning as unpermitted, high-emission peaker plants in regional airsheds.

    One story sells a narrative of friction-free software agility. The other exposes the physical consequence of unhedged iron.

    When capital markets and corporate sustainability teams confuse code with concrete, the resulting execution gap doesn’t stay on a slide deck—it gets pushed directly onto local communities, public health, and the bulk electric system.

    1. The Virtual Power Plant Mirage: Negawatts Are Not Inertia

    The concept of a 1-GW Virtual Power Plant sounds compelling in an ESG prospectus. By aggregating distributed batteries, commercial building HVAC setpoints, and flexible data center compute jobs, software promises to throttle load down when the grid is strained, creating “virtual capacity.”

    In regulatory and market design, this is the modern descendant of FERC Order 745 and demand-response accounting: treating avoided consumption as the operational equivalent of physical megawatts injected at the busbar.

    From a control-room and power-engineering standpoint, however, negawatts and physical iron are fundamentally different assets:

    • No Mechanical Inertia: A software algorithm shedding server loads does not supply physical rotational inertia or frequency response to arrest Rate of Change of Frequency (RoCoF).
    • Step-Load Volatility: When a data center curtails 50 to 100 MW in seconds to participate in an automated demand-response signal, it introduces severe sub-cycle transients, voltage sags, and harmonic distortion across the local distribution bus. As NERC highlighted in its recent Level 3 Essential Actions Alert, abrupt multi-hundred-megawatt load drops from computational facilities are triggering unpredicted system oscillations in both the Eastern and Texas Interconnections.
    • Non-Firm Dispatchability: Code depends on network communications, telemetry availability, and tenant contractual willingness to curtail. When grid conditions turn catastrophic during a winter freeze or prolonged summer heat dome, computational workloads can only be throttled so far before operational and service-level agreements (SLAs) bind.

    You can aggregate 1 GW of curtailment rights inside a cloud platform. You cannot use software code to stabilize an under-damped transmission corridor.

    2. The Peaker Creep: When the Map Collides with the Terrain

    While corporate marketing teams celebrate virtual power plants, the operational reality on the ground in Texas tells a starkly different story.

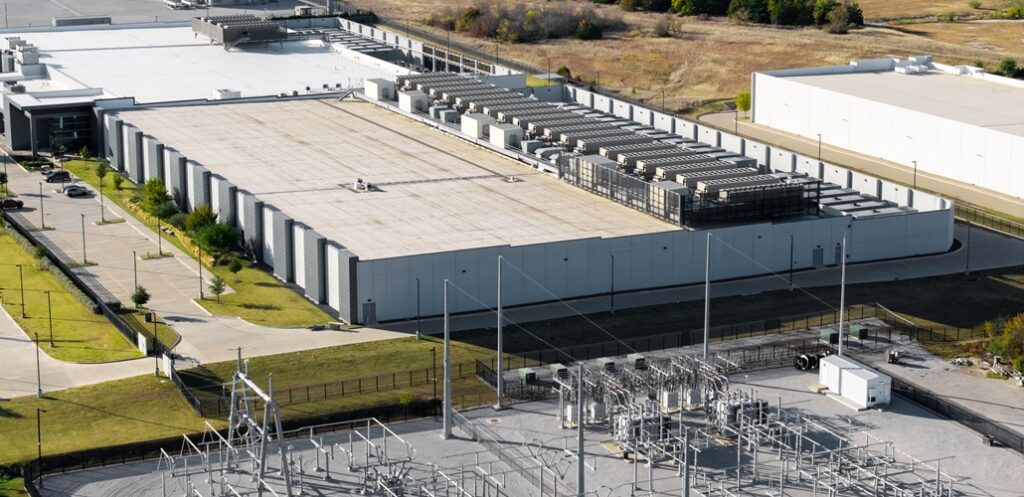
    Hyperscalers and colocation developers are deploying gigawatts of compute far faster than ERCOT or local transmission operators can construct 345 kV and 500 kV interconnections. Facing multi-year interconnection queues and thinning reserve margins, developers are taking the path of least physical resistance: installing vast arrays of multi-megawatt diesel generators behind the customer meter.

    Originally permitted strictly as emergency life-safety equipment—governed under relaxed runtime caps—these backup fleets are experiencing what we term “Peaker Creep.”

    • From Backup to Baseload Support: When locational marginal pricing (LMP) spikes to market caps, or when local transmission nodes face thermal saturation, the operational temptation to crank behind-the-meter diesel engines to bypass grid constraints becomes irresistible.
    • The Emissions Shell Game: A utility-scale combined-cycle natural gas plant must undergo years of rigorous Clean Air Act Title V permitting, continuous emissions monitoring (CEMS), and selective catalytic reduction (SCR) scrubbing. A 500-MW distributed fleet of reciprocating diesel engines, permitted incrementally as “emergency standby” assets across multiple adjacent parcels, bypasses these structural environmental controls.
    • Air Quality Degradation: The cumulative particulate matter (PM₂.₅) and nitrogen oxide (NOₓ) emissions from nearly 300 projects across Texas do not disperse into a statistical vacuum. They concentrate in regional air basins, eroding decades of regulatory progress while shifting the true environmental cost of 24/7 compute onto local residents.

    3. Double-Counting Resilience: The Core Failure Mode

    Why do these two contradictory realities exist simultaneously? Because the AI infrastructure ecosystem is built on double-counting resilience:

    1. The Software Side: Hyperscalers point to their virtual power plant commitments and carbon-neutral PPAs to satisfy ESG raters and enterprise clients.
    2. The Hardware Side: Site developers install massive, fossil-fueled reciprocating engines at the fence line to ensure the facility never actually drops a packet when the grid falters.
    3. The Utility Side: Grid operators model the data center as a high-load customer that can theoretically be curtailed under extreme conditions, while simultaneously relying on the same constrained transmission paths to wheel remote wind and solar into load centers.

    Everyone assumes the other party holds the physical risk. The developer assumes the utility will eventually build the line; the utility assumes the customer will curtail when asked; and Wall Street assumes synthetic software contracts eliminate the need for hard capital expenditures on physical grid infrastructure.

    The Forensic Reality

    The physical terrain does not care about financial or software abstractions.

    A 1-gigawatt virtual aggregation is an operational optimization tool, not a physical substitute for firm transmission capacity, synchronous condensers, and sub-cycle harmonic containment. When local planning commissions and utility boards accept software promises in place of verified physical infrastructure, the result is predictable: delayed interconnection queues, over-stressed transmission assets, and diesel exhaust billowing across rural townships.

    Until regulators and planning boards mandate forensic physical verification—requiring developers to prove sub-cycle power quality compliance (IEEE 519), verified acoustic containment, and non-polluting onsite firm capability before a zoning permit is granted—the gap between code and concrete will continue to widen.

    At the busbar, the terrain always wins.
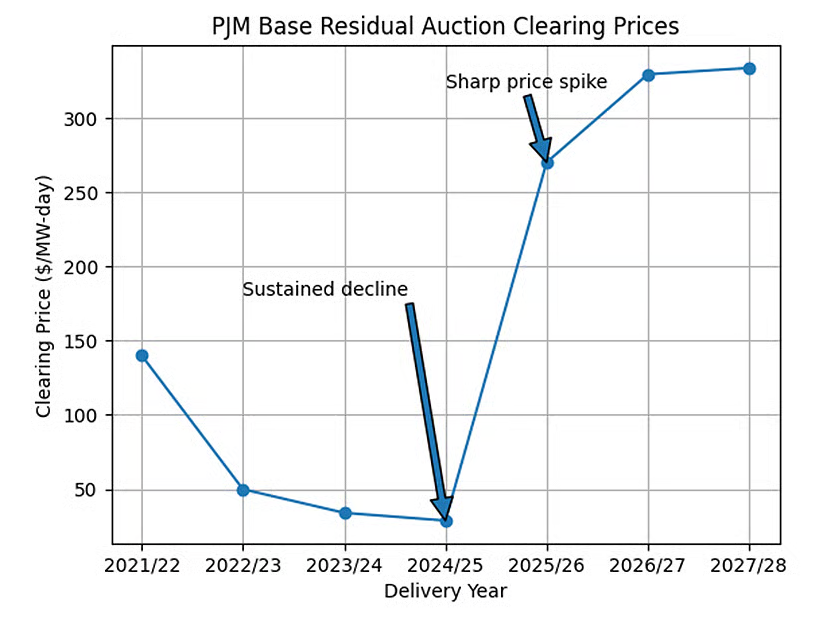
  • The 5-Month Illusion: FERC Suspends PJM’s Backstop While the Iron Clock Ticks

    When wholesale capacity prices explode from under $30/MW-day to over $330/MW-day, the market isn’t sending a gentle price signal. It is screaming a physical warning.


    Today, FERC conditionally approved PJM’s Reliability Backstop Procurement mechanism – then immediately suspended its implementation for five months to investigate if elements like cost allocation are “just and reasonable.”

    Concurrently, FERC flagged the absurdity of PJM’s legacy tariff: a construct so passive it requires three consecutive failed capacity auctions below the target reserve margin before PJM can even petition FERC to administer an emergency procurement.

    This is the textbook definition of the Execution Gap between regulatory jurisprudence and electrical engineering.

    1. Procedural Time vs. Physical Lead Time To a regulatory commission, five months is standard administrative process.

    To the high-voltage grid, five months of procedural delay is a structural hit:

    • You cannot commission an extra kilowatt of firm generation in a hearing room.

    • You cannot compress the 36-month manufacturing queue for a 500 kV transformer with a legal brief.

    • A 2-GW hyperscale compute step-load won’t pause construction while attorneys litigate Section 205 filings.

    2. A Legacy Construct Built for Surplus FERC was right to question PJM’s legacy rules. Waiting for three failed auctions made sense in an era of surplus coal and flat load growth. Today – facing rapid thermal retirements and non-linear data center demand – waiting for three straight capacity failures is the operational equivalent of waiting for a house to burn down before dialing 911.

    3. Market Signals Don’t Generate Megawatts The capacity price trajectory is the ground truth: PJM has shifted from sustained low clearing prices to a steep plateau north of $300/MW-day. High prices were supposed to spur investment. But capital cannot deploy if the queue is backlogged and heavy iron supply chains are constrained.

    The Reality FERC can pause a tariff. Attorneys can file briefs.

    The physics of the grid does not pause. Load surges, thermal units retire, and hardware lead times stretch.

    Until market designs treat decision latency as an active reliability hazard, we will continue pricing capacity at record highs while running the grid on paper margins.

  • OP-ED: “Governance Speed Is Not a Legal Abstraction; It’s an Engineering Constraint” – RTO Insider

    RTO Insider — September 2026

    “Governance Speed Is Not a Legal Abstraction; It’s an Engineering Constraint”

    In this op-ed for RTO Insider’s Stakeholder Forum, Mica Tufillaro makes the engineering case behind PJM’s governance debate: the physical grid — transformers, switchgear, interconnection queues — doesn’t wait for stakeholder consensus to finish forming. Responding to Vincent Duane’s piece on PJM’s “red/green” function split, Tufillaro argues that decision latency in grid governance is itself a reliability variable.

    “Reliability and interconnection engineering truth are not negotiable inputs to a multi-year consensus process, because the hardware they describe doesn’t pause while the process runs.”

    This engineering lens is the same one LIS Analytics applies at the facility level: our patent-pending LIS™ Engine uses sub-cycle waveform observability to find the electrical capacity already inside your infrastructure — capacity masked by harmonic distortion and structural loss, not absent. Learn how the Nodal Integrity Formula works

  • Published: “The Sub-Cycle Crisis” — Switchgear Magazine, Vol. 03 Issue 3

    Founder Mica Tufillaro’s peer-reviewed article on sub-cycle grid monitoring — examining, via a modelled 50 MW interconnection, how triplen harmonics from fast-ramping AI data center loads could stress neutral conductors, transformers, and capacitor banks — is now live in Switchgear Magazine.

    Read the full article → https://switchgear-magazine.com/magazine/vol-03-issue-3/the-sub-cycle-crisis/(free registration required)

  • The Vise Closes on Digital Infrastructure: Why the Simultaneous Collision with Electromagnetic Physics and Statehouse Economics Ends the Era of Socialized AI Cushions

    By Mica C. Tufillaro | Founder, LIS Analytics

    Two separate legal and regulatory filings hit the wire this week that, taken together, expose the exact vise closing around gigawatt-scale digital infrastructure:

    1. The Technical Wall (Physics): PJM Interconnection formally ejected Oklo’s 750 MW hybrid energy project (150 MW advanced nuclear + 300 MW fuel cells + 300 MW gas) from its Cycle 01 queue review. Why? Because the developer failed to provide a compliant, working dynamic simulation model that mathematically proves how this multi-technology facility behaves during transient grid faults. PJM’s position at FERC is uncompromising: no validated electromagnetic stability model, no queue position. Estimated delay: 14 to 24 months.

    2. The Financial Wall (Ratepayer Economics): Microsoft appealed to the Virginia Supreme Court to overturn State Corporation Commission (SCC) rules that require hyperscale data center developers to pay upfront for the massive high-voltage transmission upgrades their facilities trigger. Despite high-profile White House “ratepayer protection pledges” and corporate PR commitments to shield families from rising power bills, the tech giant is fighting in court against paying direct, upfront costs for Dominion Energy’s $1.5B+ transmission expansions.

    The Pattern Is Unmistakable

    For the last five years, digital infrastructure development operated under a double cushion:

    • The Technical Cushion: Treating the bulk electric transmission system as an infinite, unbreakable shock absorber that could passively soak up fast-switching GPU step-loads and accept complex behind-the-meter generation without rigorous dynamic modeling.
    • The Financial Cushion: Assuming that multi-billion-dollar bulk transmission upgrades (345 kV and 500 kV lines, substations, and static VAR systems) would simply be folded into broad utility rate bases and socialized across millions of captive residential utility bills.

    Both cushions just deflated simultaneously.

    1. Interconnection Is Not an Administrative Form – It Is an Electromagnetic Physics Exam

    Wall Street, venture capital, and tech executives celebrate Nuclear Regulatory Commission (NRC) pre-application meetings, Department of Energy (DOE) safety reviews, and corporate Power Purchase Agreements (PPAs).

    None of those milestones mean a single electron reaches a cluster of server racks.

    Before an advanced nuclear reactor, fuel cell, or combustion turbine can synchronize to the wire, it must survive the Regional Transmission Organization’s (RTO) rigorous dynamic stability screening.

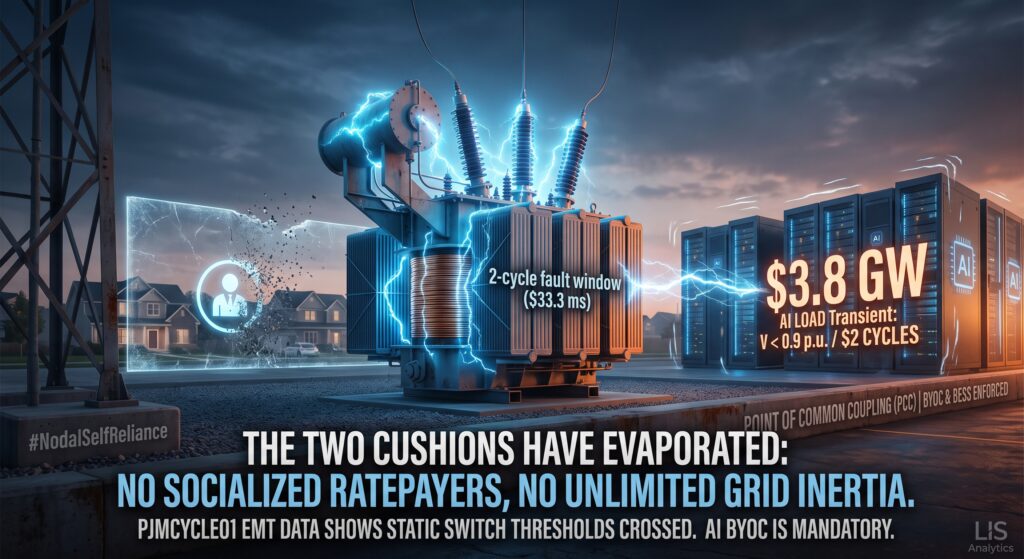
    In a post-3.8 GW transient tripping world, PJM dispatchers and transmission planning engineers will not accept black-box generator models. If an applicant cannot mathematically prove how its inverters, synchronous governors, and excitation systems react to a standard 2-cycle (33.3 ms) voltage sag (V < 0.9 p.u.), the facility does not get energized.

    The queue does not award bonus points for clean tech labels. If your electromagnetic transient (EMT) modeling is deficient, you lose your queue priority. Period.

    2. “Cost Causation” Has Arrived at the Statehouse

    While tech firms sign non-binding federal pledges promising to “protect residential ratepayers,” state utility commissions and state legislatures are grappling with local reality:

    residential electricity bills are climbing double digits, and communities are revolting.

    Virginia’s SCC drew a firm, legally grounded boundary: If your data center buildout triggers a $1.5 billion transmission expansion, you must pay for that iron upfront.

    You cannot:

    1. Demand dedicated high-voltage capacity on accelerated timelines,
    2. Privatize the computational upside and shareholder valuation, and then
    3. Socialize the stranded asset risk and 40-year capital cost across residential utility meters.

    Challenging that upfront cost allocation in state supreme courts may buy legal time, but it deepens public backlash and accelerates state-level legislative crackdowns nationwide.

    The Operational Takeaway: The Mandatory Pivot to Nodal Self-Reliance

    The era of relying on paper grid assumptions and subsidized public corridors is over.

    If developers want to energize gigawatt-scale loads before 2030, the only viable operational path forward is Nodal Self-Reliance:

    ✔ Sub-Cycle Dynamic Integrity: Engineering verified dynamic voltage ride-through at the Point of Common Coupling (PCC) using grid-forming BESS and synchronous condensers – holding terminal busbar voltage (V > 0.9 p.u.) during routine transmission faults so sensitive static switches don’t trigger cascading trips.

    ✔ Bring-Your-Own-Capacity (BYOC): Placing firm, dispatchable behind-the-meter generation directly at the site boundary to avoid triggering billion-dollar macro grid upgrades.

    ✔ Self-Balancing Grid Citizenship: Operating as an autonomous, islandable node capable of buffering internal dynamic step-loads locally rather than relying on public spinning reserves.

    The macro power grid is neither an infinite shock absorber nor an infinite bank account. Are your generation and site development roadmaps engineered for verified ground-truth physics and busbar economics – or are you caught between an interconnection queue ejection and a ratepayer revolt?

  • The Node: Ground Truth in Grid Capacity Analysis

    Updated October 2026: this analysis corrects the July edition’s description of the Duke study and of the NERC and FERC records.

    A thesis has been circulating in energy and data center circles: that a third of U.S. grid capacity sits unused, and that flexible demand could unlock 100–300 GW of new data center load without building a new power plant.

    The Duke University study behind it is more careful than the popular framing. Its finding: if new large loads accepted curtailment for about 0.5% of their running time, roughly 177 hours a year and mostly partial, the largest U.S. balancing authorities could take on about 98 GW of new load before exceeding what planners already prepare for. That’s a meaningful finding, and its authors are clear about one limit: they did not model transmission.

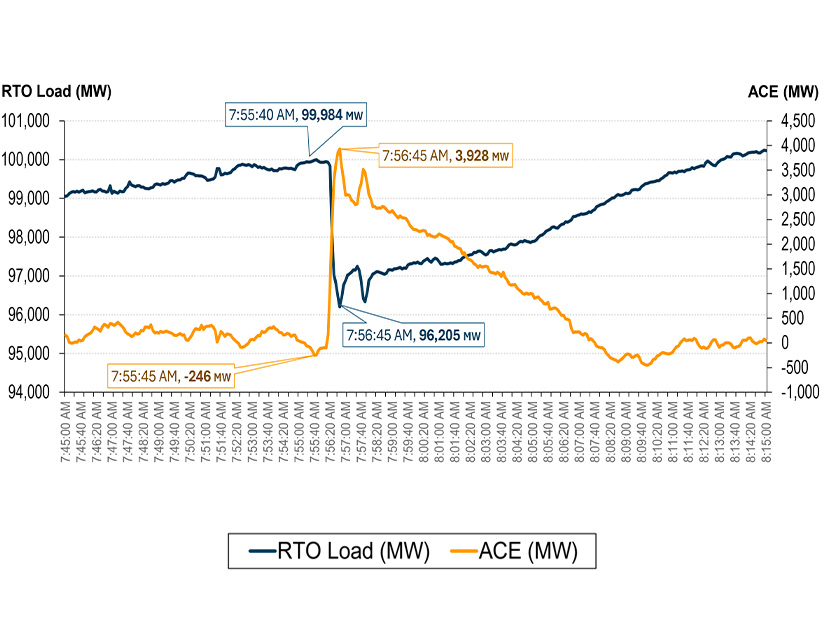
    There is a second limit. The study’s curtailment is planned: scheduled, ramped and partial. The load losses NERC is now acting on were not. On July 10, 2024, six normally cleared faults on a Virginia transmission line caused about 1,500 MW of data center load to disconnect at once as the facilities switched to backup power. In July 2026, a load reduction of nearly 4 GW followed in the same region. NERC says the grid has “not experienced, nor planned or operated for” simultaneous load losses on this scale.

    This is the gap between the administrative map and the physical terrain.

    Regulators are working both sides of it. FERC’s June 18, 2026 show-cause orders asked all six FERC-regulated RTOs/ISOs to fix how they study and connect large loads, including through flexible large-load services. NERC has issued a Level 3 alert, a reliability guideline that calls for power quality monitoring before commissioning, and new standards requiring disturbance recording at large sites.

    A capacity study tells you what the spreadsheet says. Measurement at the point of connection tells you what the physics says. The full analysis looks at three limits of the headroom thesis and what the regulatory record shows.

    The Node — Analysis Request

  • What Actually Drives Your Demand Charge

    Your demand charge is set by the highest average power your facility draws over a short metering interval each month, usually 15 or 30 minutes. Five things decide how high that number is and what it costs you, and most of them are visible on your bill and your interval data.

    How demand is measured

    Utilities bill energy (kWh) and demand (kW) separately. Demand is the highest average kilowatts reached and sustained over a 15- to 30-minute interval in the billing period (utility explanation). The charge pays for the transformers, lines and substations that must stand ready for your peak.

    Because demand is an average, brief events barely move it. A 100 kW motor that draws six times its running current for 5 seconds at start adds about 500 kW for 5 seconds. Averaged over a 15-minute (900-second) interval, that is roughly 3 kW. What sets your demand is how much load runs at the same time for most of an interval, not momentary spikes.

    5 things that drive your demand charge

    1. Loads running at the same time. Chillers, air handlers, pumps, compressors and process equipment that run together in the same interval set the peak. Staggering start times and shifting flexible loads out of the peak interval can lower it without reducing what the facility does.
      • Check: find the interval that set last month’s peak and list what was running then.
    2. A ratchet clause. Under a ratchet, billed demand is the larger of this month’s peak or a percentage of an earlier peak. A typical ratchet uses 80% of the highest peak in the previous 11 months (PNNL), so one summer spike can raise your bills for most of a year.
      • Check: look in your tariff for “ratchet”, “minimum demand” or a percentage of a prior peak. Compare billed demand with metered demand on each bill.
    3. Power factor. Many tariffs raise billed demand when power factor falls below a set level, often 90%. Two utilities that do: billed kW = peak kW × 0.90 ÷ your power factor (Austin Energy, Minnesota Power). At 70% power factor, a 100 kW peak is billed as about 129 kW. Others bill demand in kVA, which has the same effect.
      • Check: look for “power factor”, “kVA” or “reactive” on your bill and in your tariff. If none appears, power factor is not costing you on this account.
    4. Your rate schedule. Utilities offer several commercial and industrial schedules, and a facility’s load may have changed since it was placed on one. Some schedules charge demand only during on-peak hours, which rewards moving load.
      • Check: ask your utility account representative which schedules you qualify for and to compare a year of your bills under each.
    5. What you can’t see. Monthly bills show one peak. Interval data shows every 15-minute block, so you can see when peaks happen, how often, and what they line up with.
      • Check: request 12 months of interval data from your utility. Many utilities provide it on request for demand-billed accounts.

      Where to start

      If two or more of these checks raise a question, start with your bills, your tariff and 12 months of interval data. Together they show what set each peak and which parts of the charge you can influence.

      LIS Analytics offers a $2,500 Quick Scan that reviews them for you and reports which peaks were avoidable and what to do next. It needs no new equipment, and the fee is credited toward a Full Forensic Assessment within 30 days.

      Request a Quick Scan · mica@lisanalytics.net · (610) 835-6556